
ggplot2を使って、散布図を書きたい。
という悩みを解決します。
今回は、ggplot2を使って散布図をつくります。テーマ別に作り方がかいてあるので、必要なところだけ、ご覧ください。
散布図をつくる目的・実行環境
目的
散布図を使って、データを可視化する。
実行環境
- Windows10
- Rstudio
MacでもLinuxでも可です。
散布図をつくる
使うデータ
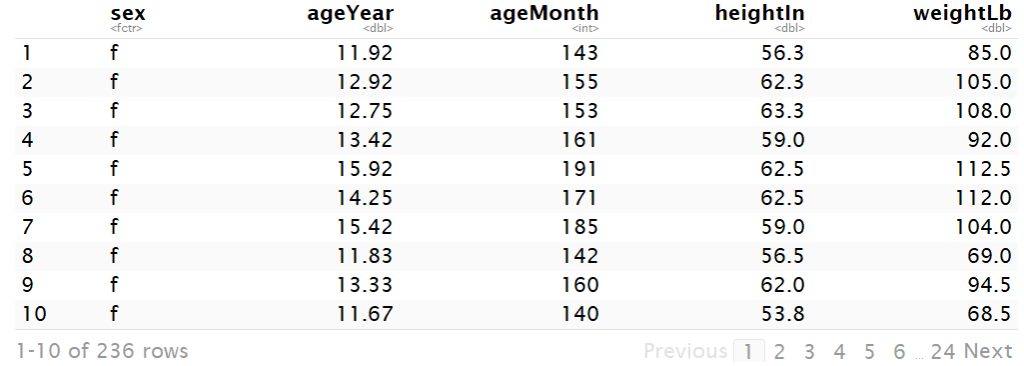
使うデータは、gcookbookパッケージのデータ【heightweight】を使います。各自のデータがある方は、そちらを使ってください。
【heightweight】のデータの概要はこんな感じです。
必要なパッケージ
- ggplot2
- gcookbook(データがある方は必要ない)
この2つを使います。パッケージの使い方がわからない方は、【R】RStudioでパッケージをインストールする方法と読み込みまでの流れをご覧ください。
先にパッケージを読み込みましょう。
library(ggplot2)
library(gcookbook)
シンプルな散布図
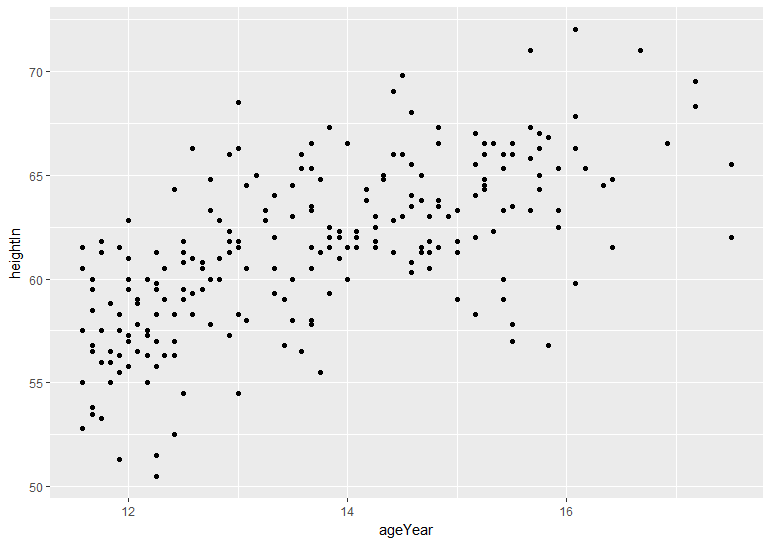
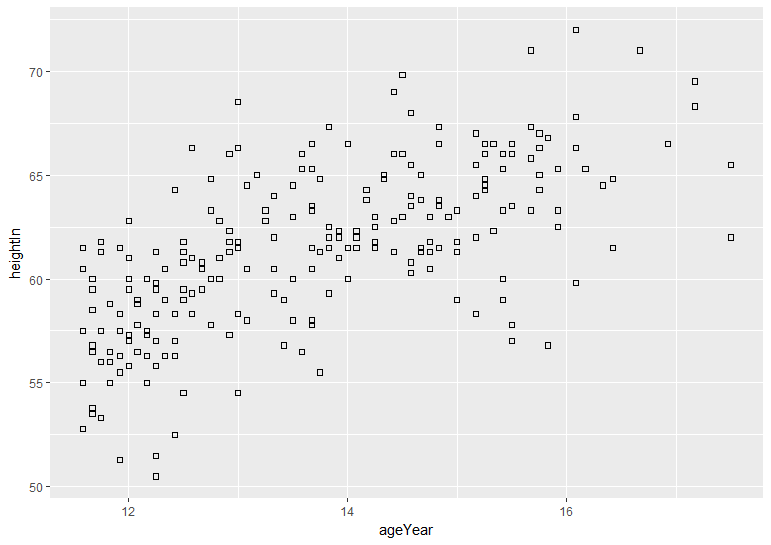
シンプルな散布図をつくる
ggplot(heightweight,aes(x=ageYear,y=heightIn))+geom_point()ggplot(データ名,aes(x=x軸にしたいデータ,y=y軸にしたいデータ)) + geom_point
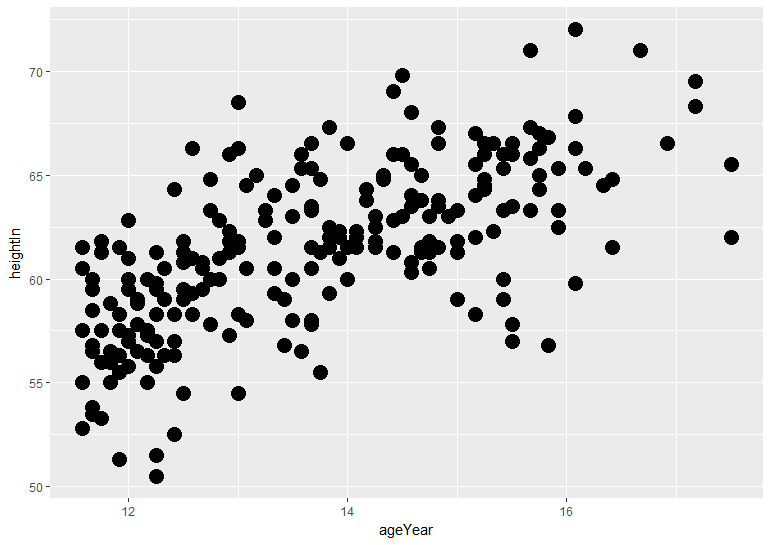
ポイント(点)の大きさを変える
ggplot(heightweight,aes(x=ageYear,y=heightIn))+geom_point(size=5)ggplot(heightweight,aes(x=ageYear,y=heightIn))+geom_point(size=数字)
| size=数字 | ポイントの大きさを変える |
ポイント(点)の形を変える
ggplot(heightweight,aes(x=ageYear,y=heightIn))+geom_point(shape=0)ggplot(heightweight,aes(x=ageYear,y=heightIn))+geom_point(shape=数字)ここの数値を変えると形が変わる0~25
| shape=数字 | ポイントの形を変える |
3つの変数を使う
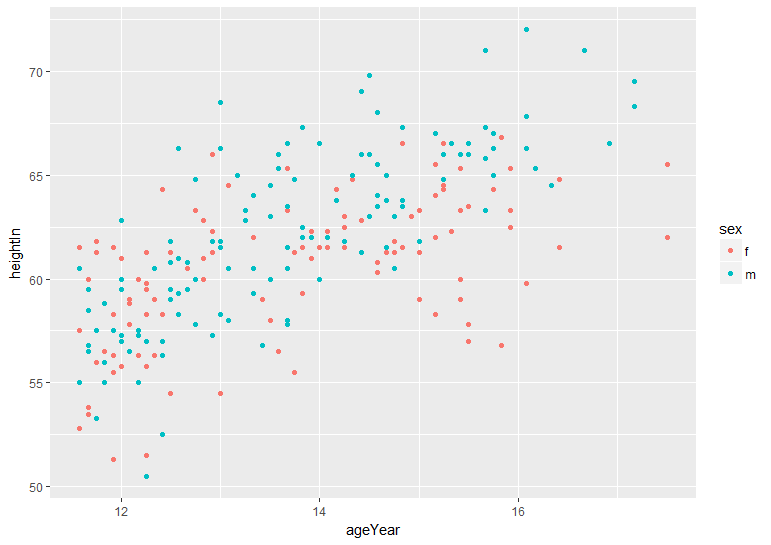
色分けして散布図にする
性別ごとに分けたりすることですね。
ggplot(heightweight,aes(x=ageYear,y=heightIn, colour=sex))+geom_point()ggplot(heightweight,aes(x=ageYear,y=heightIn, colour=sex))+geom_point()
↑変数を入れる
| colour=データ名 | 分けたい変数名をいれる |
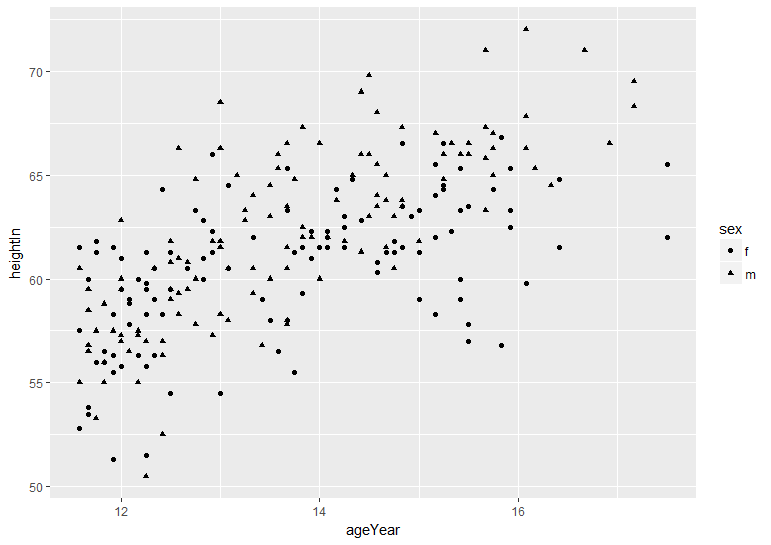
形分けして散布図にする
色ではなく、形で分けます。
ggplot(heightweight,aes(x=ageYear,y=heightIn, shape=sex))+geom_point()ggplot(heightweight,aes(x=ageYear,y=heightIn, shape=sex))+geom_point()
↑グループ化したいデータを入れる
| shape=変数 | わけたい変数をいれ、形によって分類される |
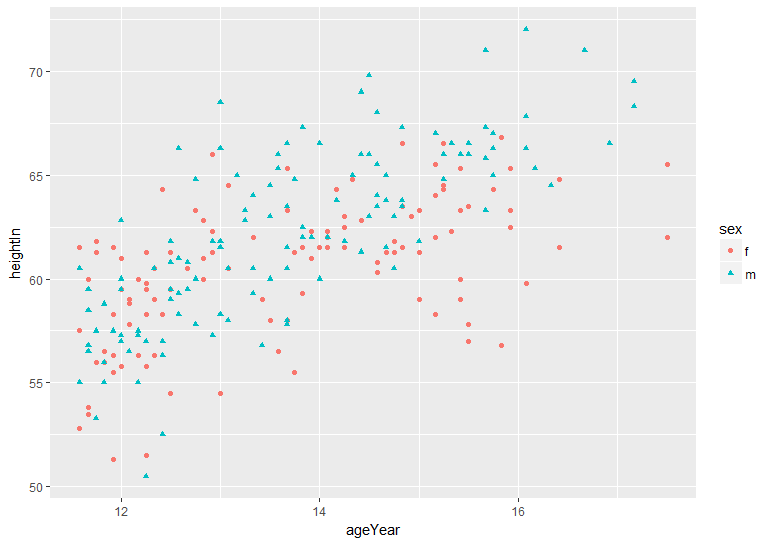
色分けして形かえて散布図
ggplot(heightweight,aes(x=ageYear,y=heightIn, colour=sex,shape=sex))+geom_point()ggplot(heightweight,aes(x=ageYear,y=heightIn, colour=sex,shape=sex))+geom_point()
| colour=sex,shape=sex | 形と色で分かれる |
ポイントの形を変える
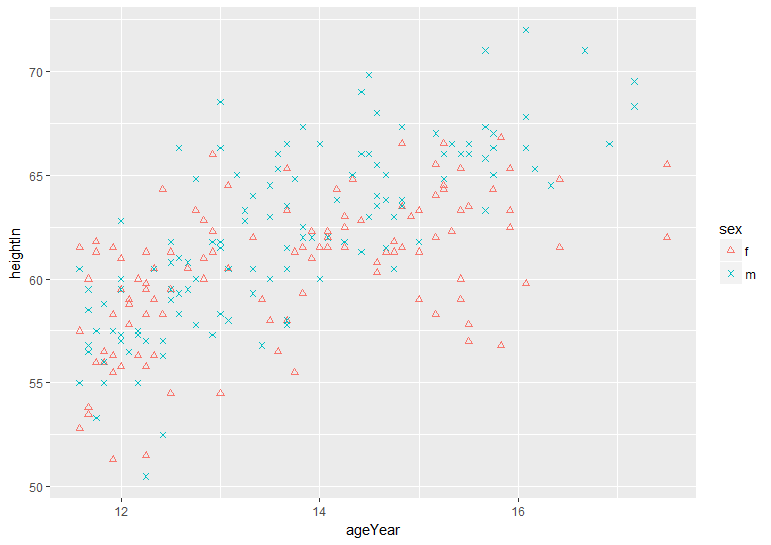
ggplot(heightweight,aes(x=ageYear,y=heightIn, colour=sex,shape=sex))+geom_point() +
scale_shape_manual(values = c(2,4))
ggplot(heightweight,aes(x=ageYear,y=heightIn, colour=sex,shape=sex))+geom_point() +
scale_shape_manual(values = c(2,4))
| scale_shape_manual(values = c(数字,数字)) | グループ化した変数の形を変える |
ポイントの色を変える
通常のままだとわかりにくいので、色を変えていきます。
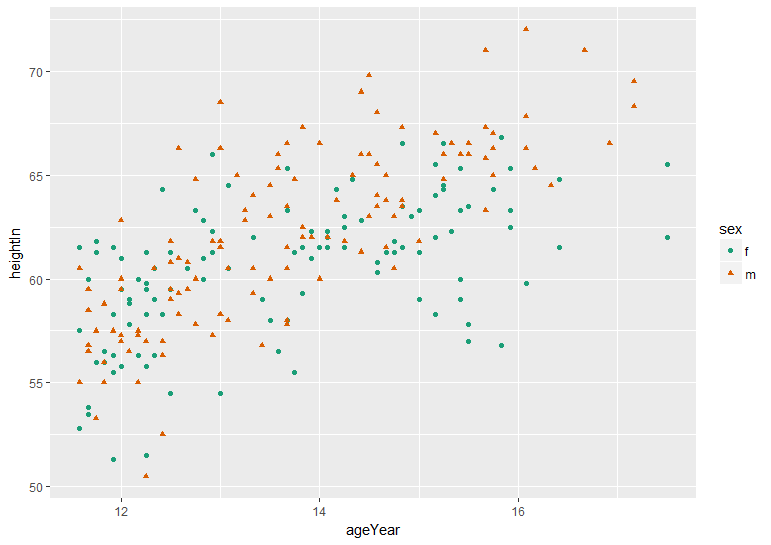
ggplot(heightweight,aes(x=ageYear,y=heightIn, colour=sex,shape=sex))+geom_point() +
scale_color_brewer(palette = "Dark2")
↑ポイントの色を変えています。
| scale_color_brewer(palette = "色") | ポイントの色を変える |
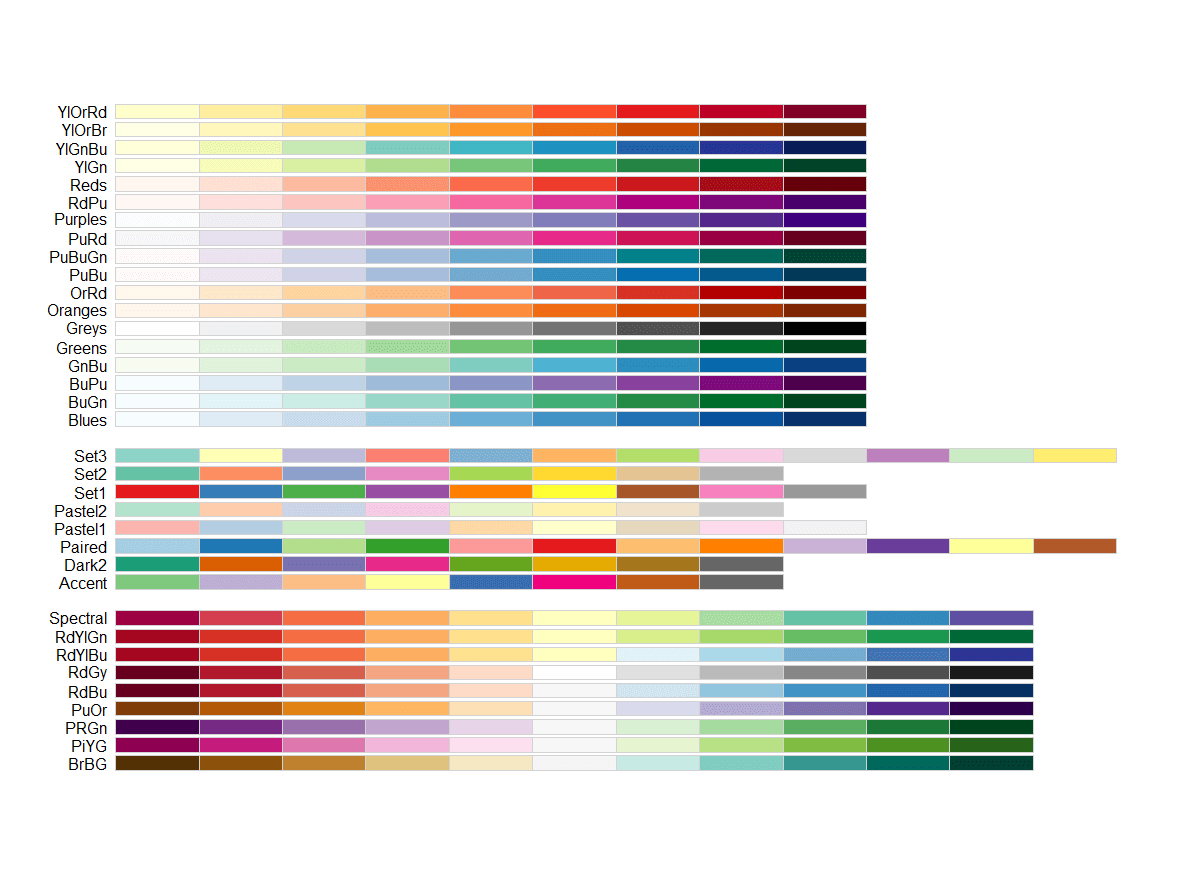
この色というのは、こんだけ種類があります。好きな色に分けてみてください。
3つ目の連続値変数を使った散布図
身長が高くなるごとに、体重が増加することを色やポイントの大きさを使って、表していきたい場合に使います。
数値と色が比例
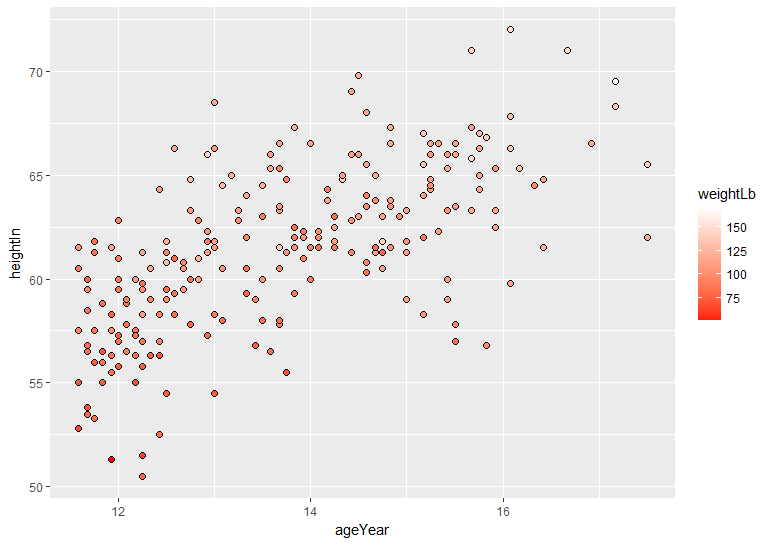
ggplot(heightweight,aes(x=ageYear,y=heightIn,fill=weightLb)) +
geom_point(shape=21, size=2.0) +
scale_fill_gradient(low = "red",high = "white")
ggplot(heightweight,aes(x=ageYear,y=heightIn,fill=weightLb)) +
geom_point(shape=21, size=2.0) +
scale_fill_gradient(low = "red",high = "white")
↑fillで入れた変数が高くなるほど、白、低くなるほど、赤になる
| scale_fill_gradient(low = "色",high = "色") | fillの数値に対応している。fillでいれた変数の値が小さいほど、lowの色に近づき、高くなるほど、highの色に近づく |
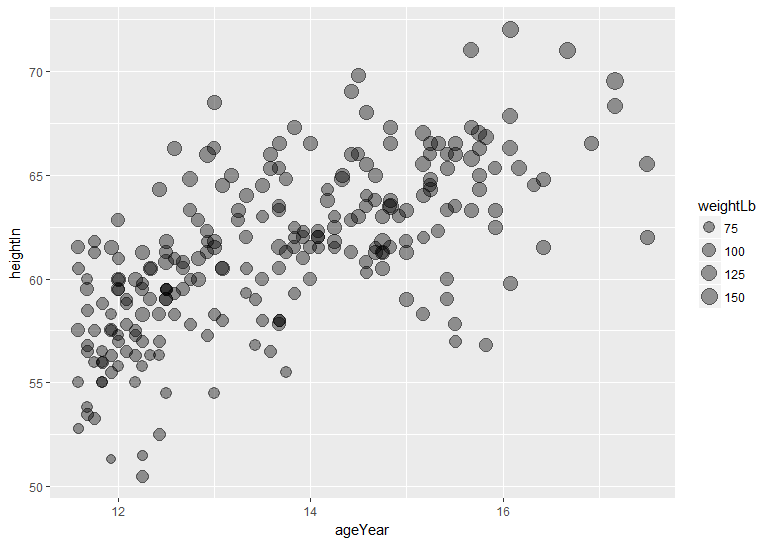
数値と大きさが比例
ggplot(heightweight,aes(x=ageYear,y=heightIn,size=weightLb))+
geom_point(alpha=0.4)+
scale_size_area()
ggplot(heightweight,aes(x=ageYear,y=heightIn,size=weightLb))+
geom_point(alpha=0.4)+
scale_size_area()
scale_size_area()でsizeの値が比例する(ポイントが大きくなる)
| scale_size_area() | sizeの値と比例して、ポイントが大きくなる |
| alpha=数値 | 明度0~1まで(色の透明度を表す) |
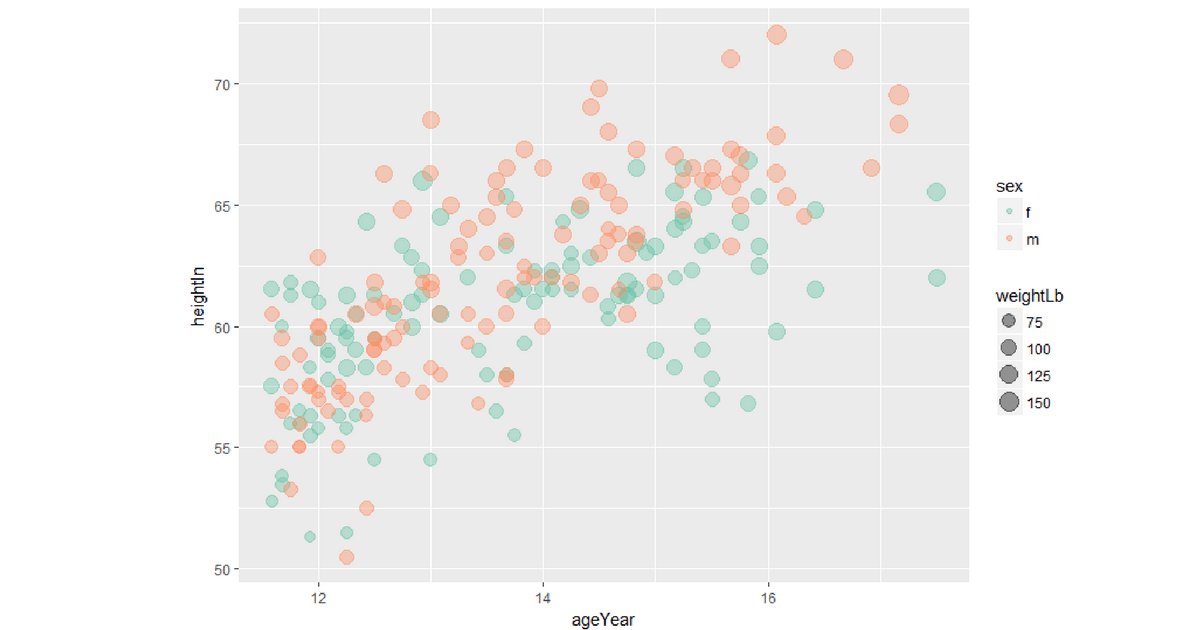
色と値と大きさで散布図
日本語で上手く表すことができなくてすいません。
ggplot(heightweight,aes(x=ageYear,y=heightIn,size=weightLb,colour=sex))+
geom_point(alpha=0.4)+
scale_size_area()+
scale_color_brewer(palette = "Set2")
ggplot(heightweight,aes(x=ageYear,y=heightIn,size=weightLb,colour=sex))+
geom_point(alpha=0.4)+
scale_size_area()+
scale_color_brewer(palette = "Set2")
| scale_size_area() | sizeの値と比例して、ポイントが大きくなる |
| scale_color_brewer(palette = "色") | ポイントの色が変わります |
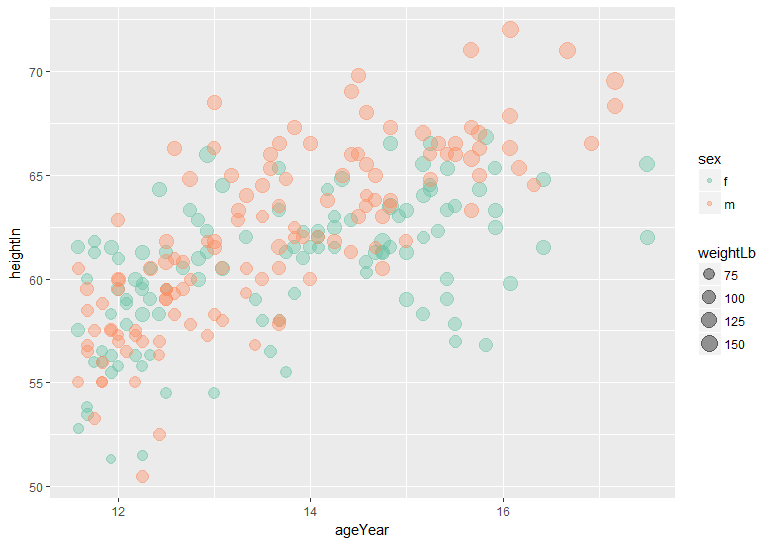
色はこれです。
まとめ
| size=数字 | ポイントの大きさを変える |
| shape=数字 | ポイントの形を変える |
| colour=データ名 | 分けたい変数名をいれる |
| shape=変数 | わけたい変数をいれ、形によって分類される |
| colour=sex,shape=sex | 形と色で分かれる |
| scale_shape_manual(values = c(数字,数字)) | ポイントの形を変える |
| scale_color_brewer(palette = “色”) | ポイントの色を変える |
| scale_fill_gradient(low = “色”,high = “色”) | fillの数値に対応している。fillでいれた変数の値が小さいほど、lowの色に近づき、高くなるほど、highの色に近づく |
| scale_size_area() | sizeの値と比例して、ポイントが大きくなる |
| alpha=数値 | 明度0~1まで(色の透明度を表す) |
以上ggplot2をつかって散布図を様々な方法でした。

参考文献
Rグラフィックスクックブックを参考にこの記事を書かせていただきました。とても参考になるので、Rでグラフ作成をしたい人は是非、購入してみてください。


コメント